Lesson 1: Types of Data & Study Design
Welcome!

Let’s Pick A Section Marcher
Section Marcher Duties:
- Take roll and report attendance
- Designate a different inspector each day (find a system - rotate alphabetically?)
- Everyone will do this multiple times
Inspections:
- Polite check of uniforms - the idea is to help each other look right
- No one is getting in trouble. We’re just helping each other avoid mistakes.
- You can do the inspection before class starts
Introductions
Cadet Introductions
Draw the outline of your state on the board and put a star where your hometown is. Do not write the name of your state or hometown.
TipPlease Share
- Name
- Hometown
- Company
- Birthday
- Academic Major
- What you do in the Corps (Sport, Club, etc)
- Favorite sports team
- Possible Branch
- What makes you unique?
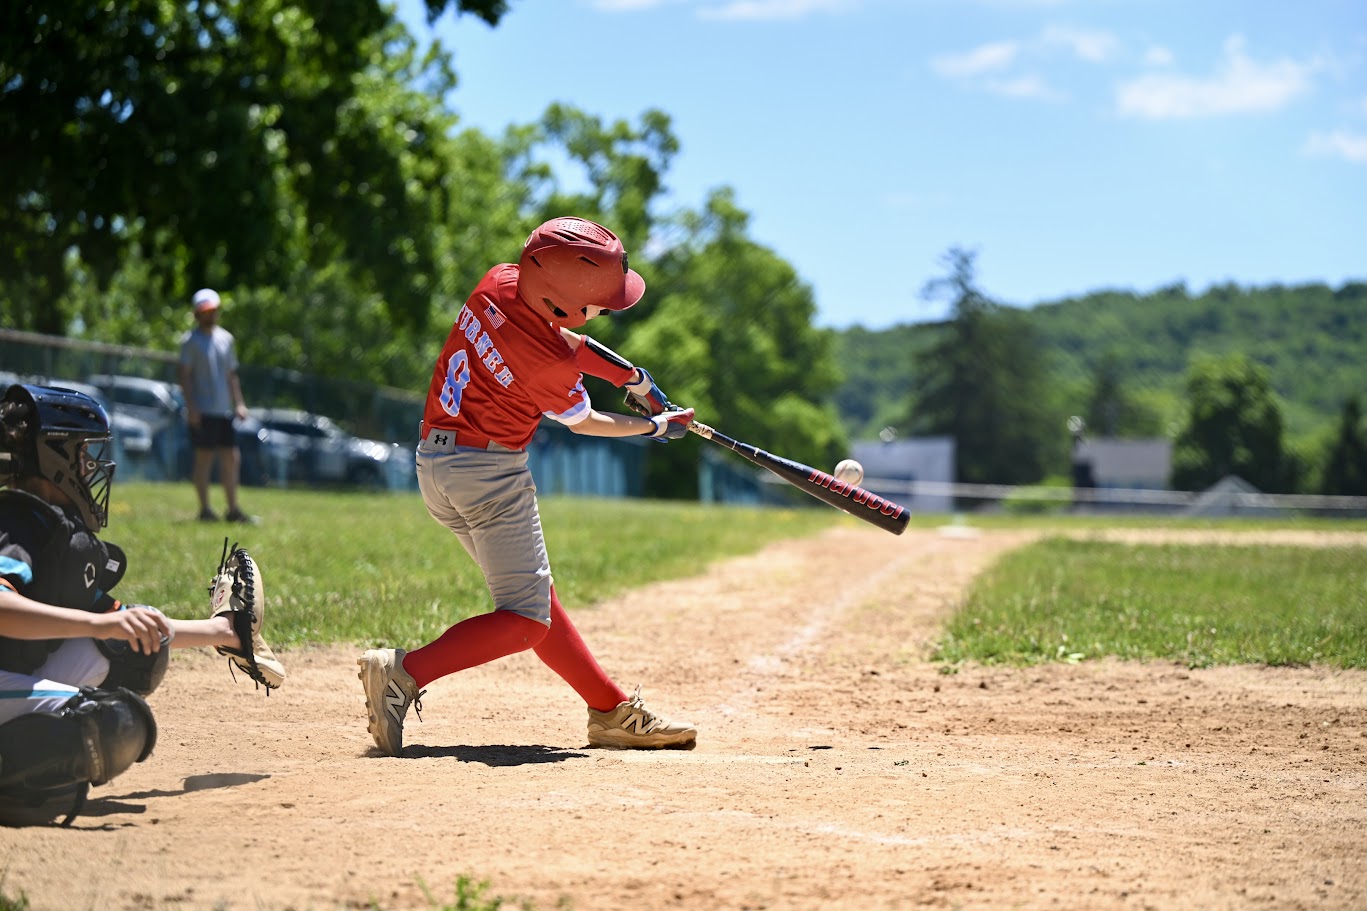
CDT Dusty Turner: Center Point, Texas
- Sprint Football
- Sandhurst
- OCF
- F4
- Dallas Cowboys, San Antonio Spurs, Texas Rangers
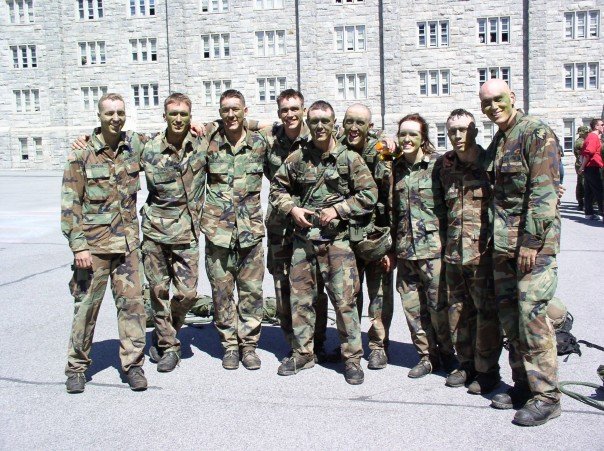
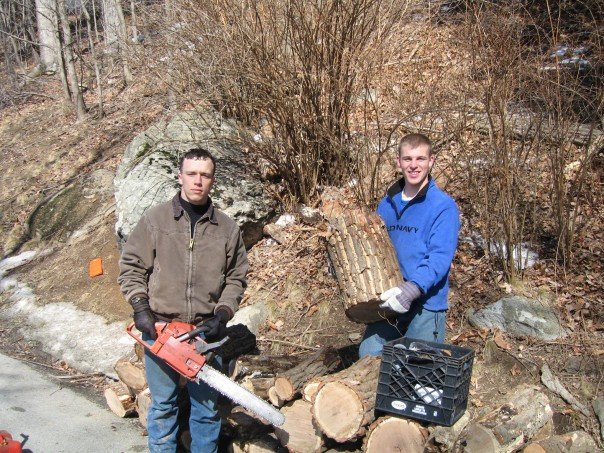
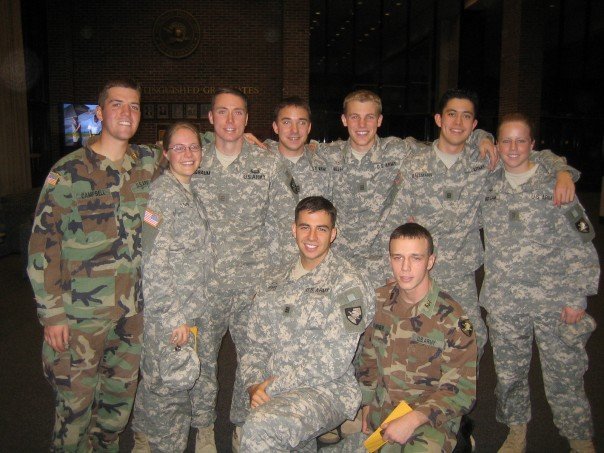
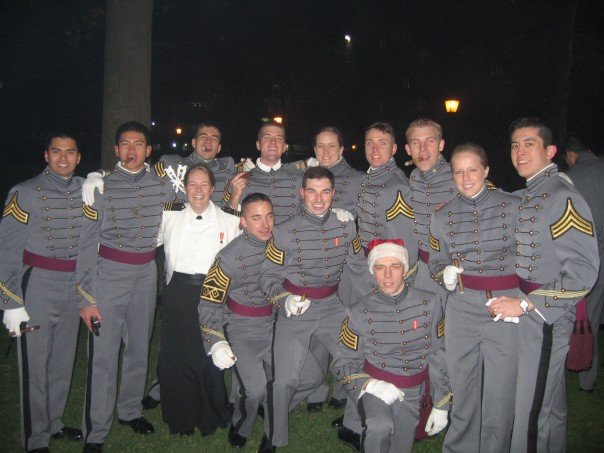
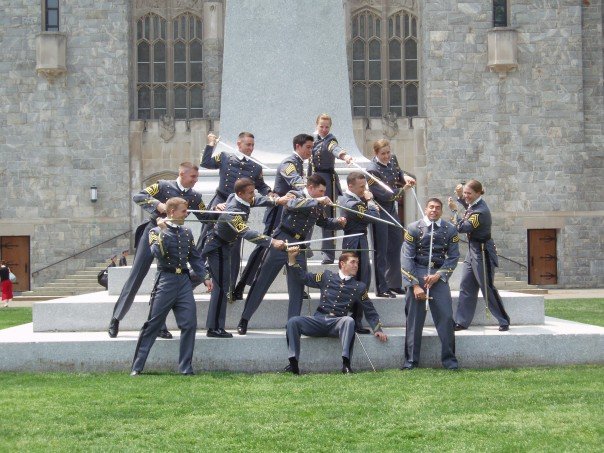
LTC Dusty Turner, PhD: Waco, Texas

NoteCareer Timeline
- 2003-2007 BS, Operations Research: United States Military Academy (USMA)
- 2007-2008 Engineer Basic Officer Course: Fort Leonard Wood, Missouri
- 2008-2011 Platoon Leader / XO / AS3: Schofield Barracks, HI / Iraq
- 2011-2012 Engineer Captain’s Career Course: Missouri S&T
- 2012 MS, Engineering Management: Missouri S&T
- 2012-2014 Company Commander: White Sands Missile Range, NM / Afghanistan
- 2014-2016 MS, Integrated Systems Engineering: The Ohio State University
- 2016-2019 Assistant Professor: United States Military Academy, West Point
- 2019-2022 ORSA / Data Scientist: Center for Army Analysis, Ft. Belvoir
- 2022-2025 PhD, Statistical Science: Baylor University (Waco, TX)
- 2025-? Academy Professor: United States Military Academy, West Point

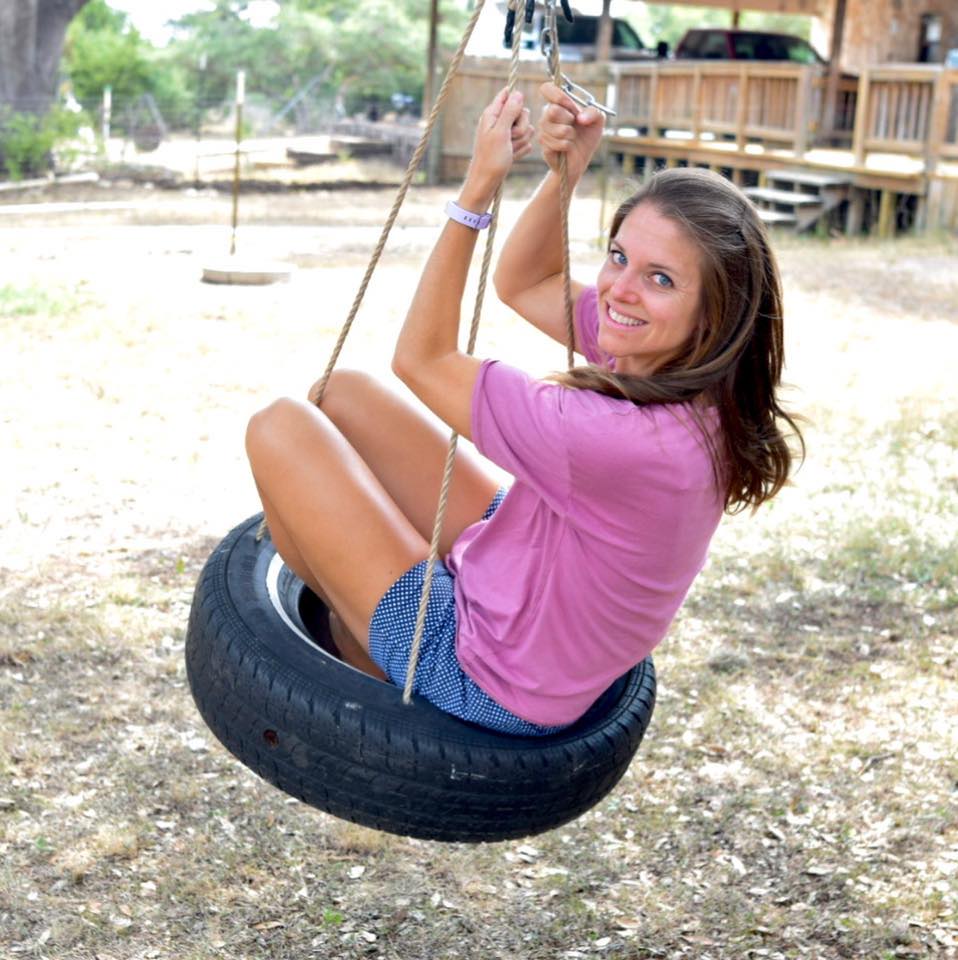
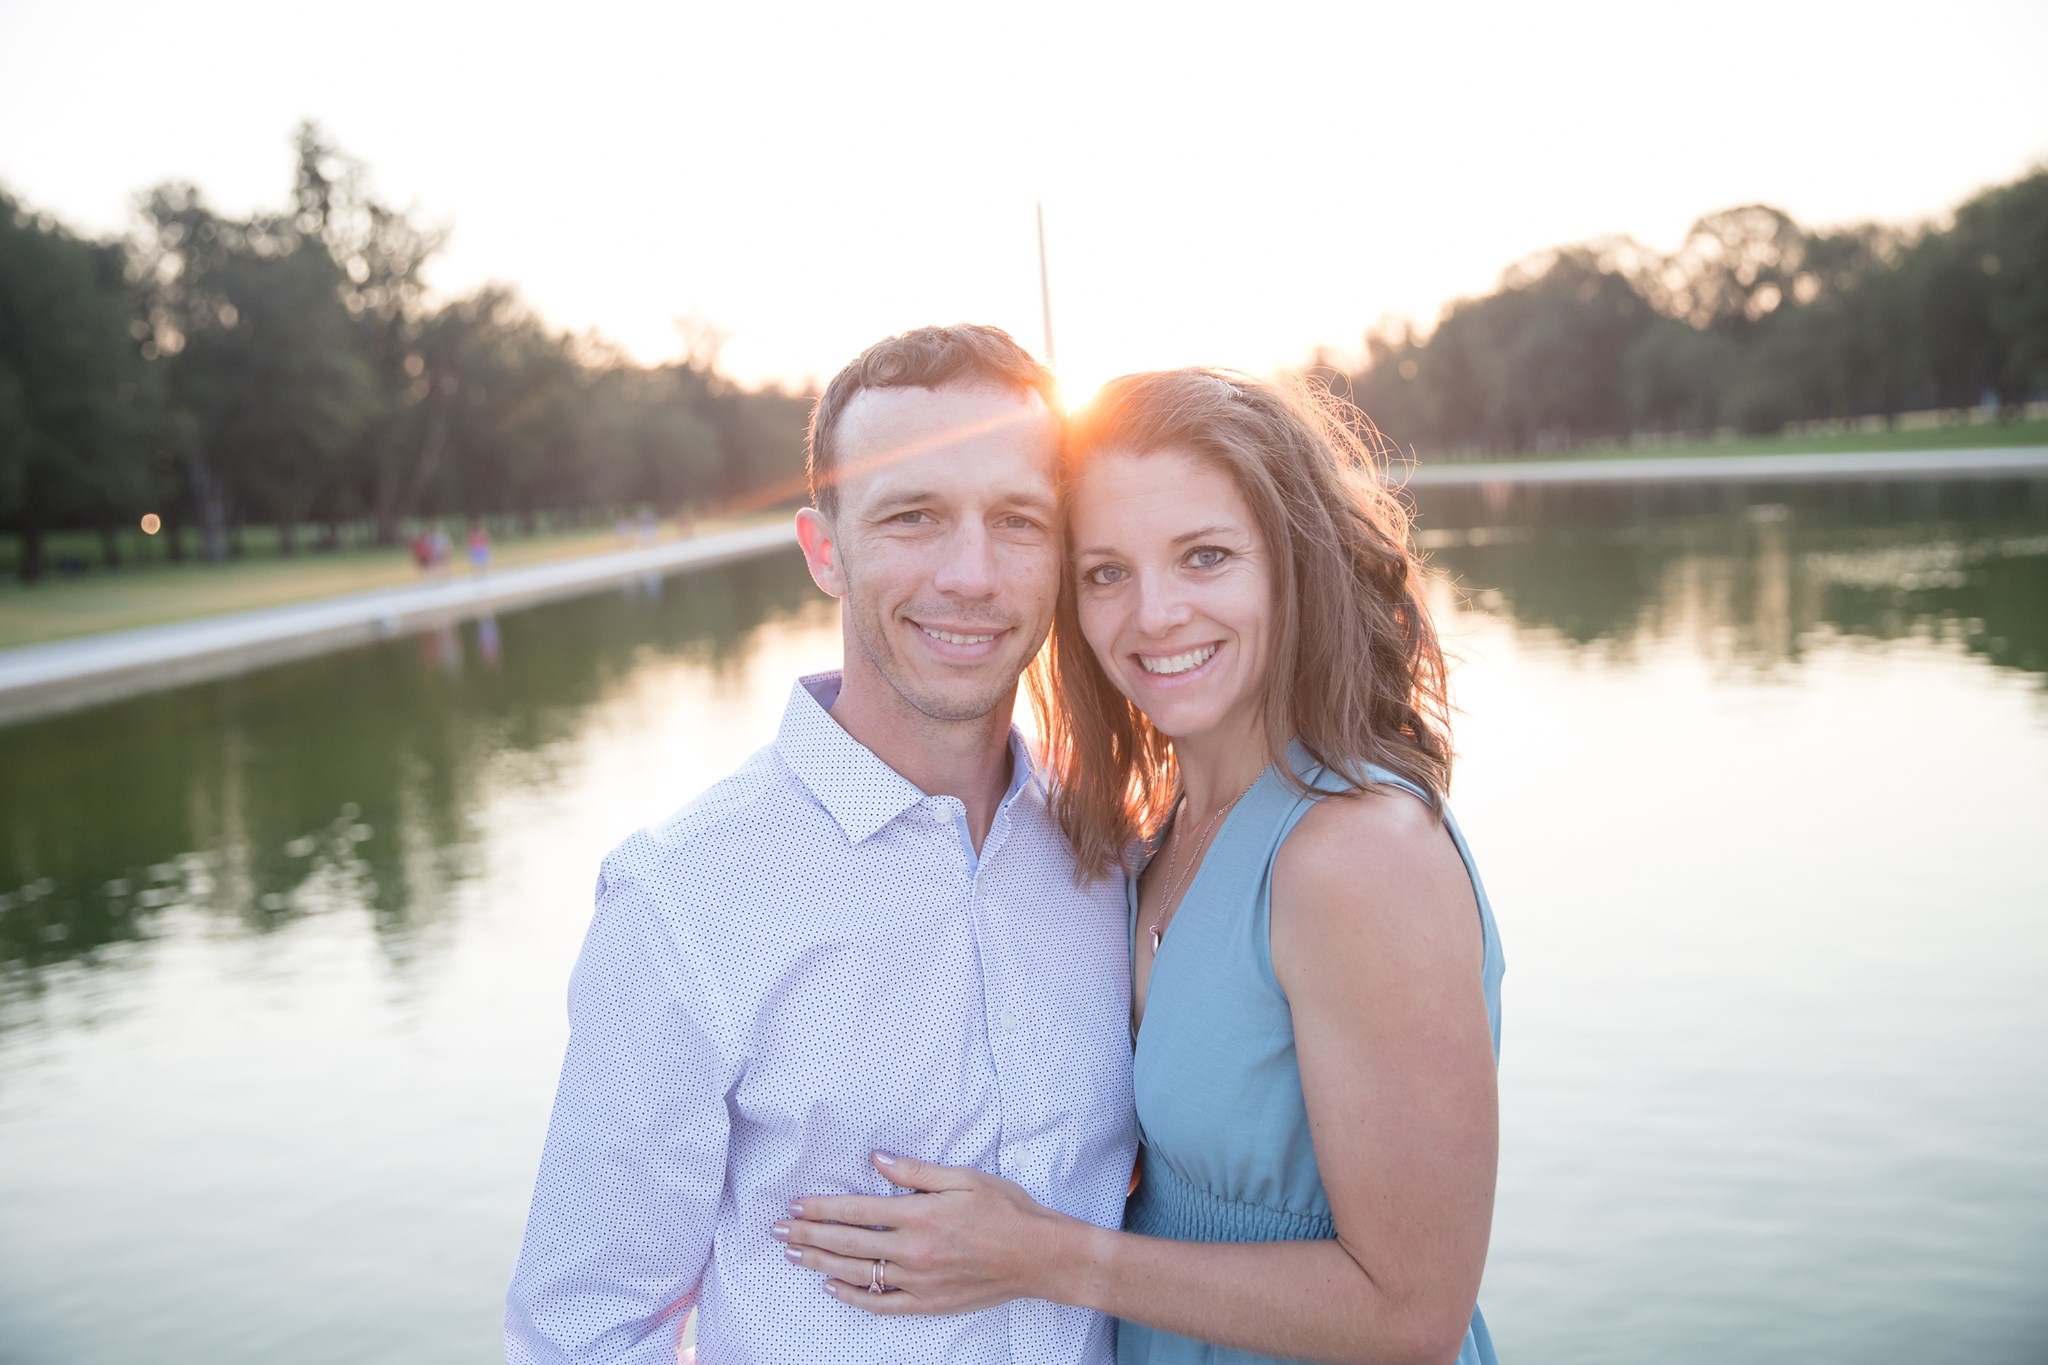
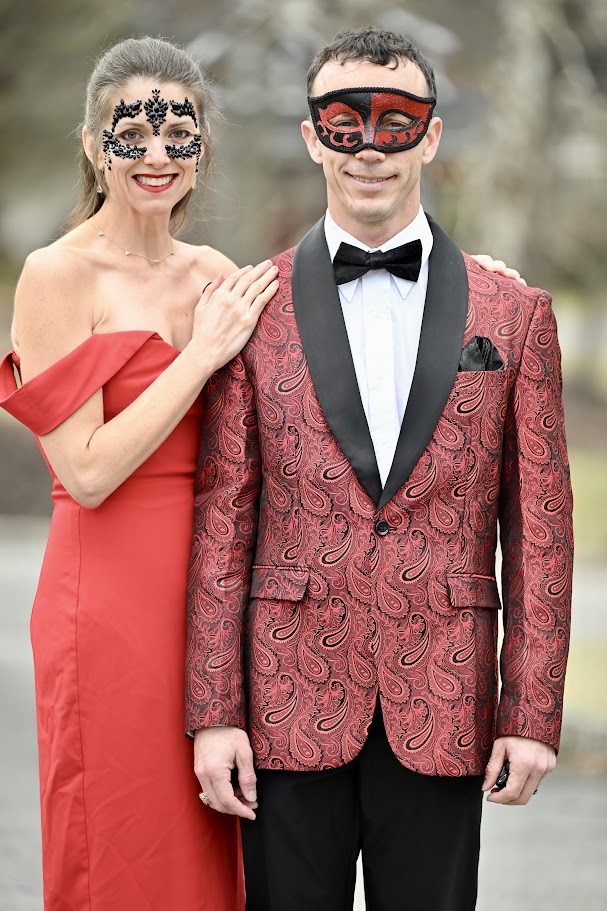
Jill: Saline, Michigan
NoteCareer Timeline
- 2000-2004 BS, Economics: Michigan State University
- 2004-2010 Project Manager: Epic Systems
- 2011-2020 Consultant / Build Analyst (Epic Radiant & Cadence)
- 2011-2013 Epic Radiant Build Consultant: Intellistar Consulting
- 2014 Epic Radiant Build Analyst: Vonlay
- 2016-2017 Epic Radiant Build Analyst: Huron
- 2018-2020 Epic Cadence Build Analyst: Bluetree Network
- 2020-Present Solutions & Application Architect / Principal Analyst: Mayo Clinic


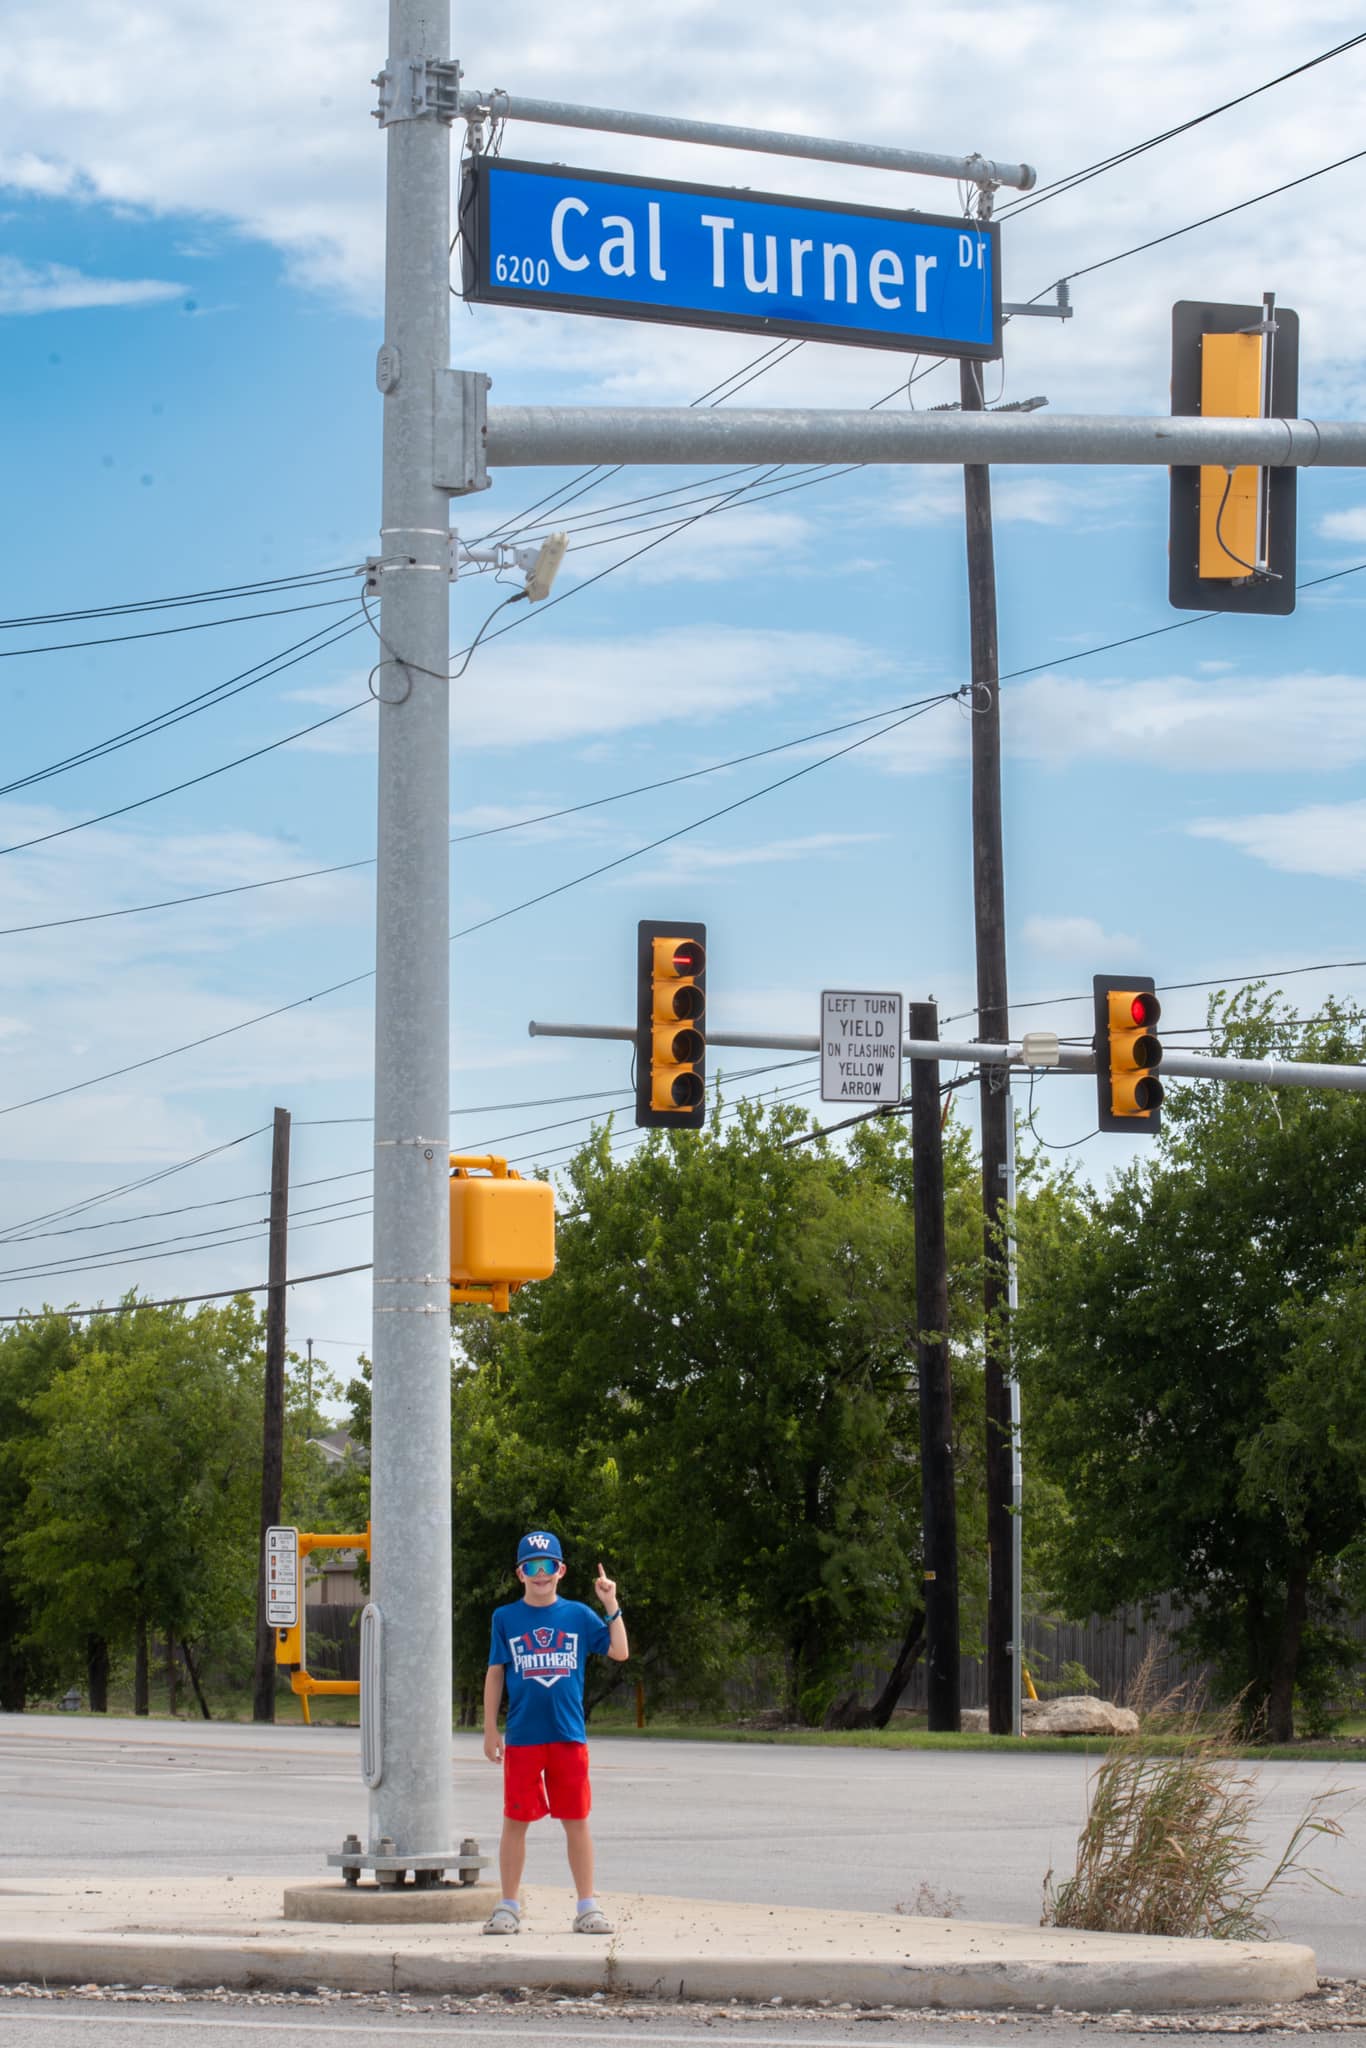
Cal: Las Cruces, New Mexico
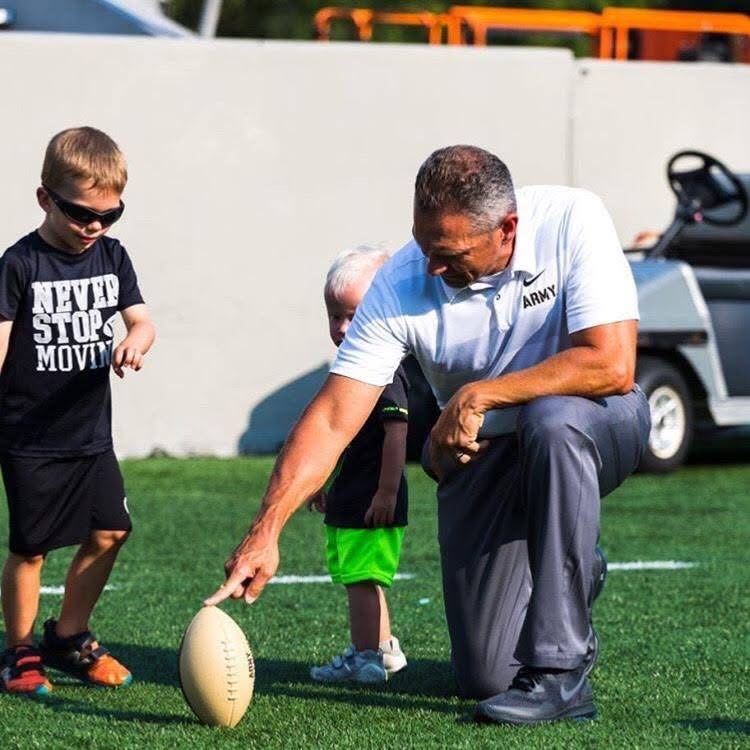
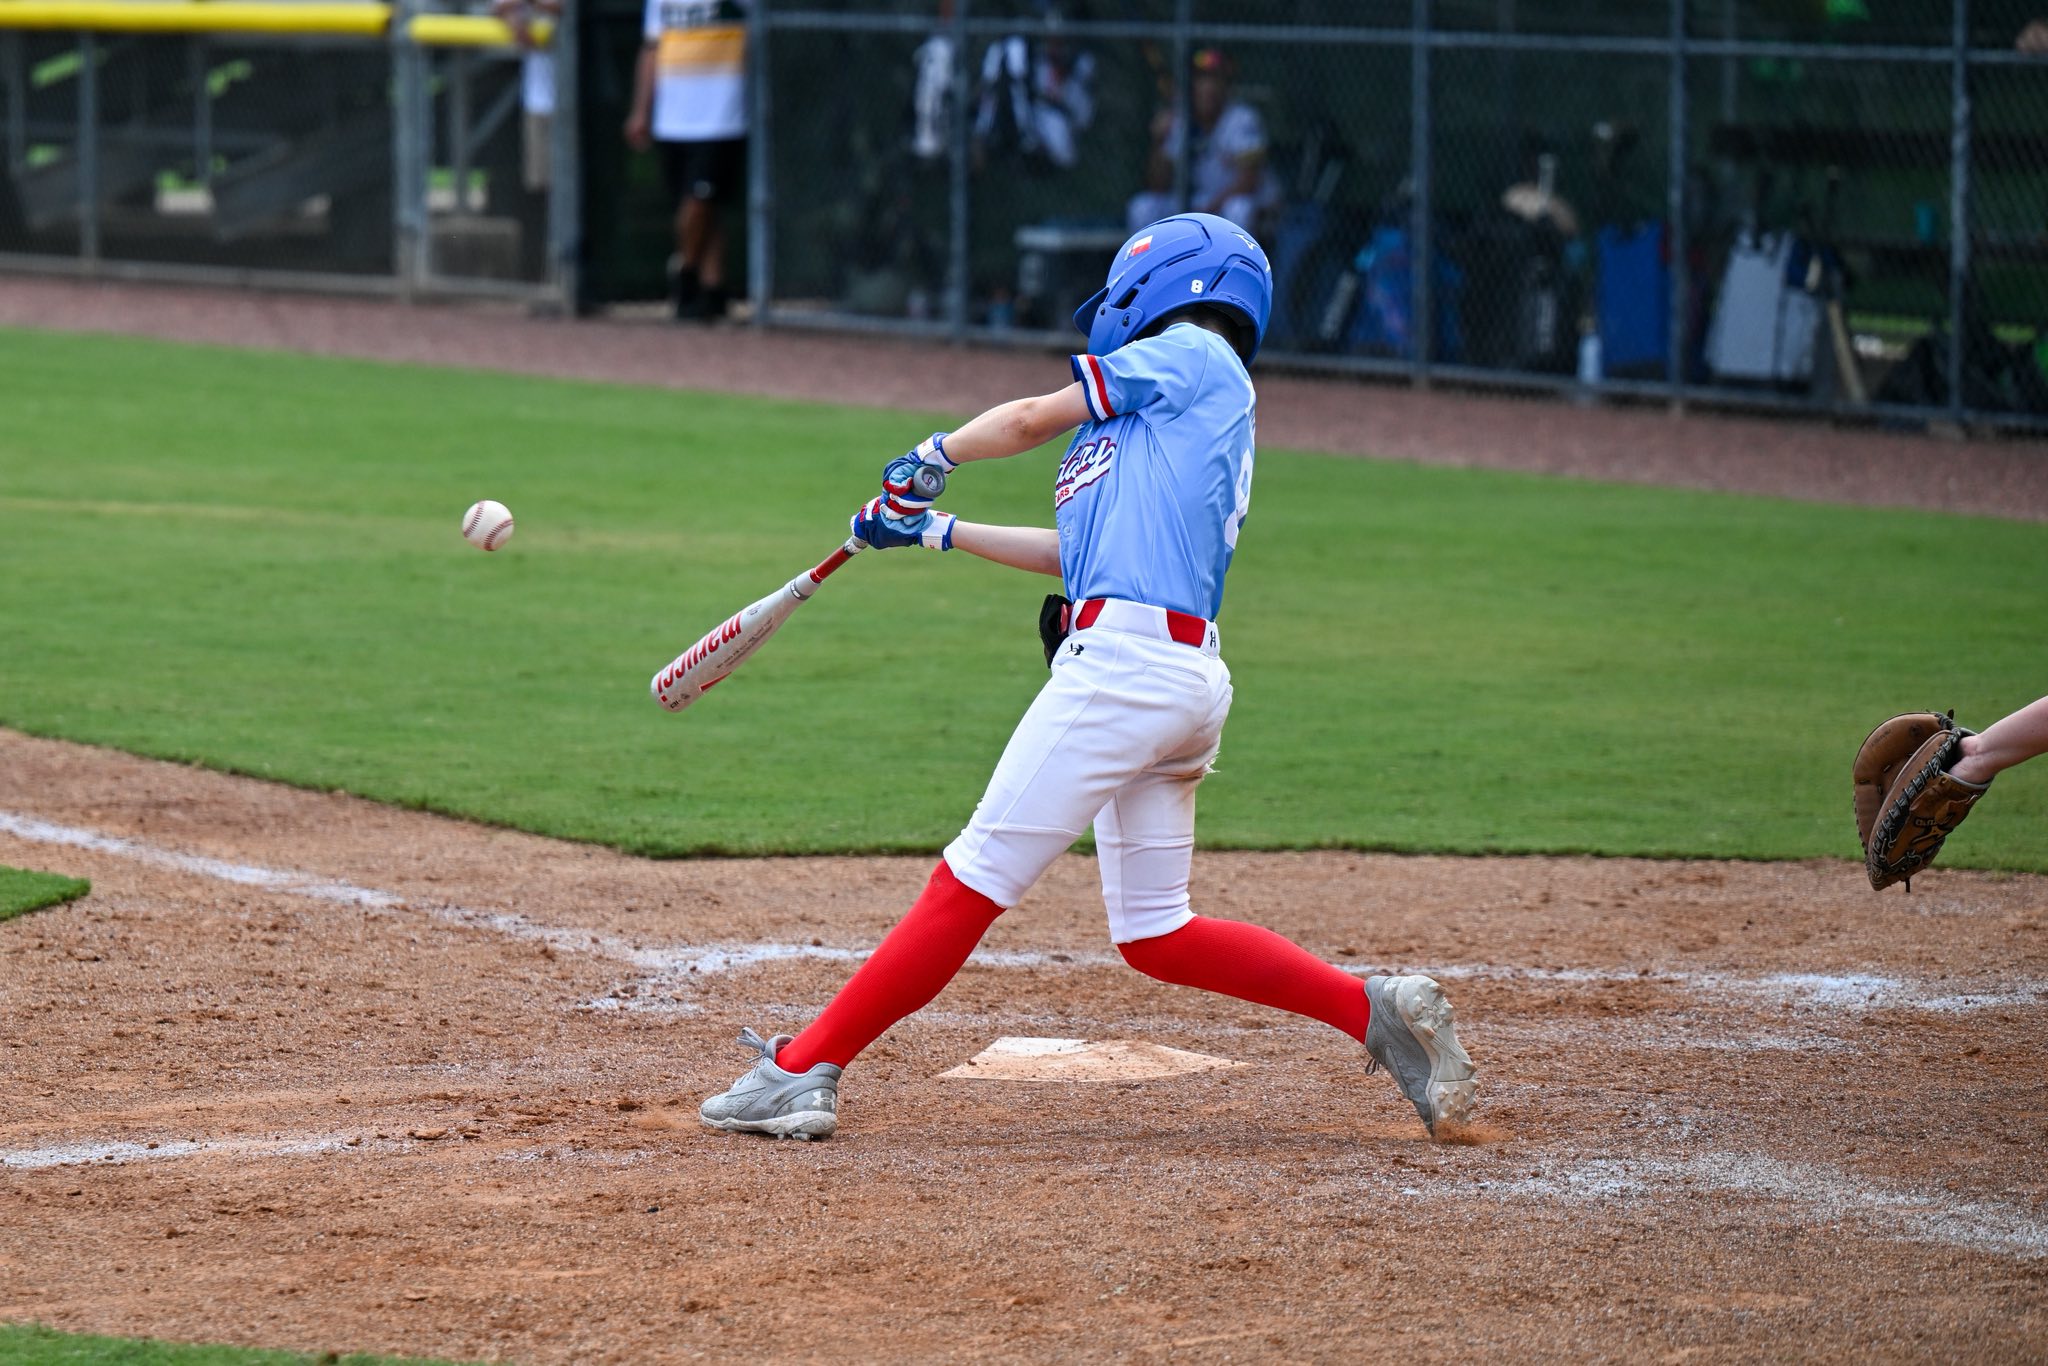
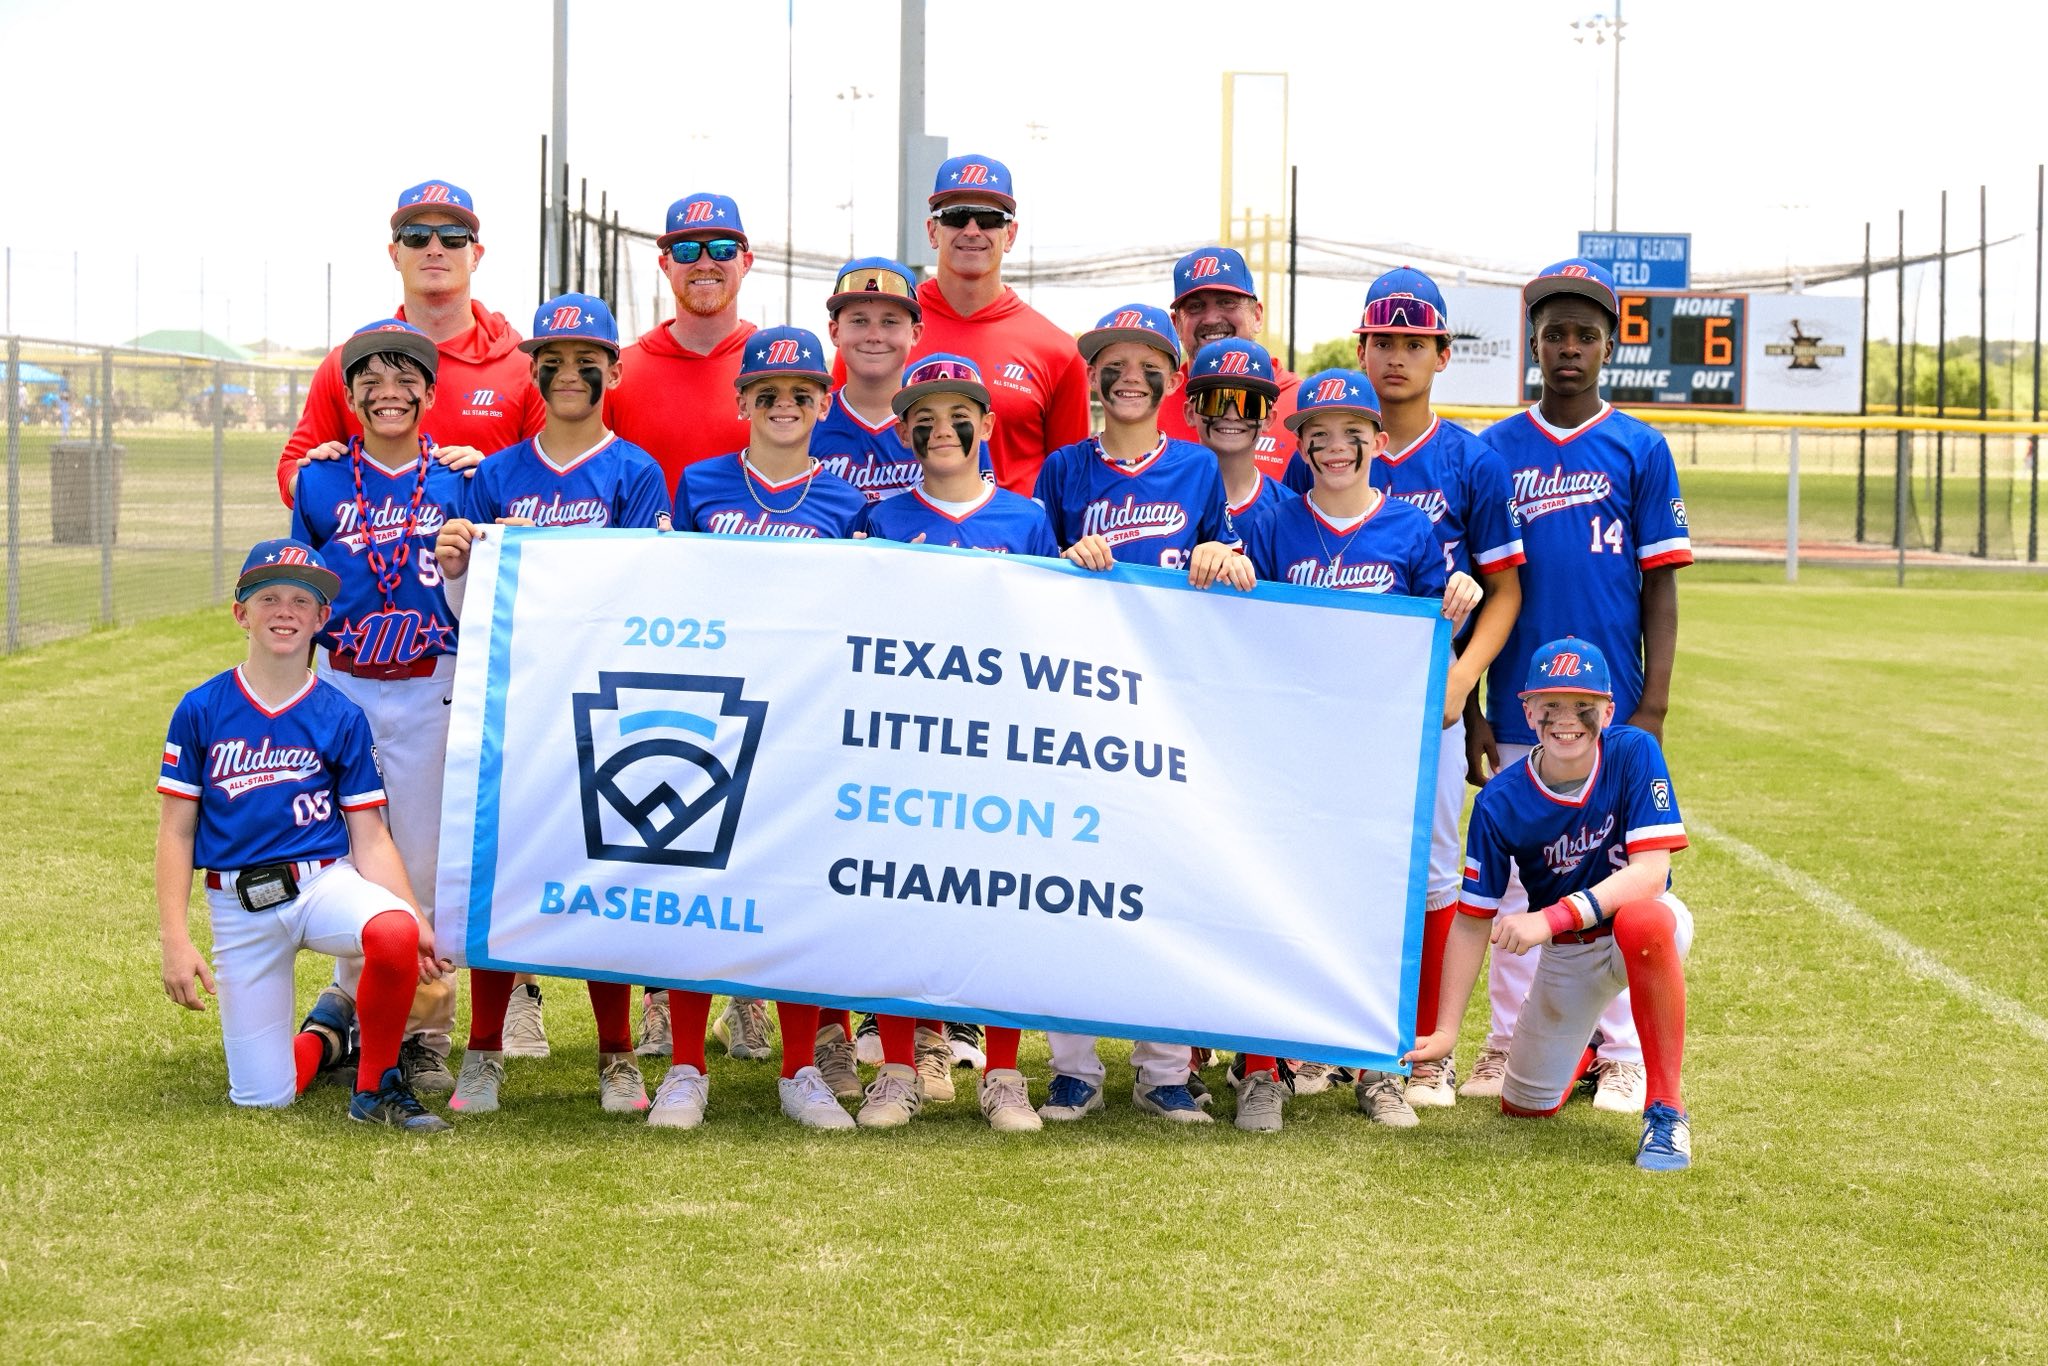

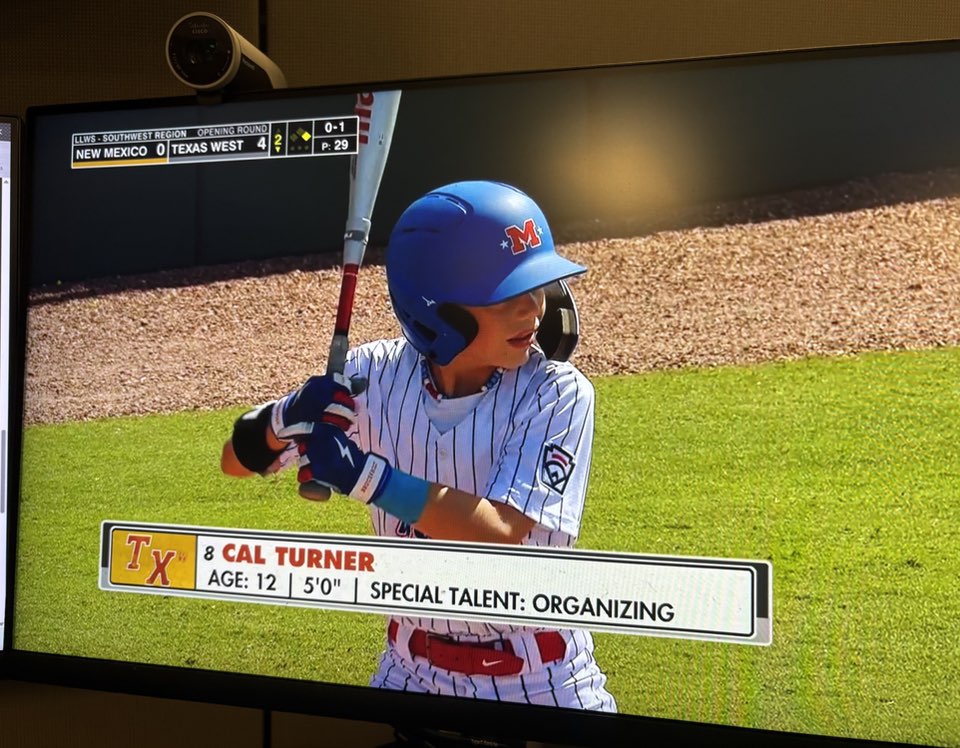
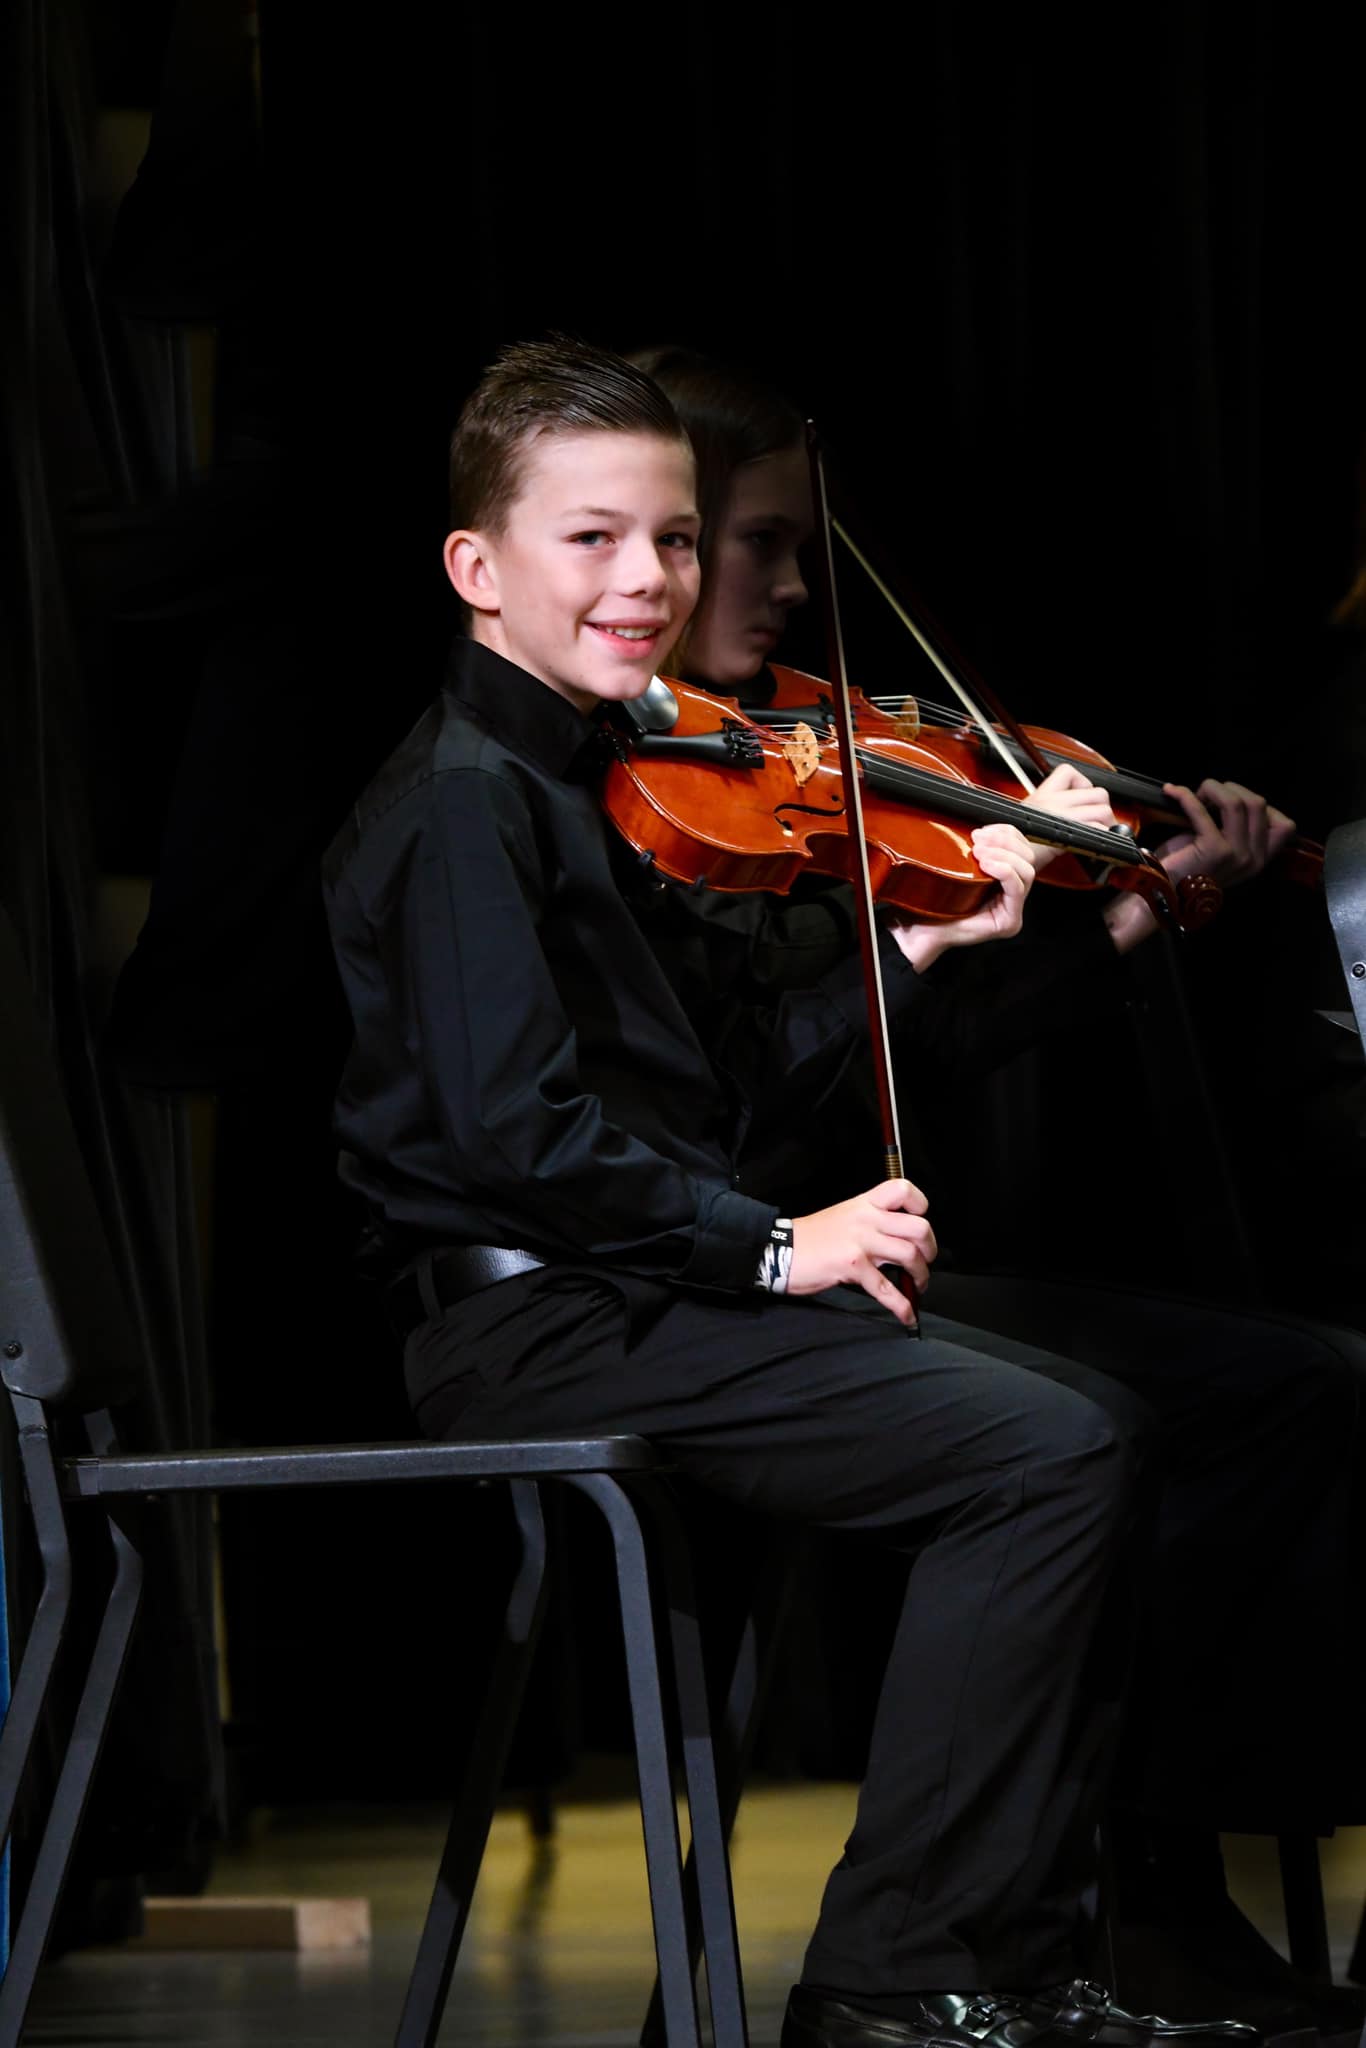
Reese: Columbus, Ohio
Expectations
What Are Your Expectations of MA206?
NoteMy Goals for the Course
- Learn to Think Statistically
- Develop Habits of Mind
- Learn Army Systems
- Responsible Use of AI
What Do You Expect of Me?
(Open discussion)
What We Can Expect from Each Other
NoteMy Commitments
- Arrive prepared for each lesson
- Encourage independent thinking
- Maintain professionalism and respect at all times
- Uphold the values of the Corps and our institution
- Clear guidance and expectations for assignments
- Be a professional mentor
- Make Mistakes
NoteYour Responsibilities
- Be responsible for your learning
- Arrive prepared for each lesson
- Engage actively in discussions and exercises
- Maintain professionalism and respect at all times
- Uphold the values of the Corps and our institution - you are junior members of this profession
- Make mistakes
Class Rules
WarningClassroom Policies
| Policy | Details |
|---|---|
| Computers | Course materials only |
| Food & Gum | Not allowed in classroom |
| Drinks | Spill-proof containers only |
| Bags & Gear | Leave in the hallway |
| Staying Alert | Stand up if you’re tired |
| Punctuality | Arrive on time; don’t pack up early |
| Leadership | Support the section marcher |
Course Overview
The MA206 Story
Block I: Descriptive Statistics and Probability
Lessons 1-16, WPR I at Lesson 16.
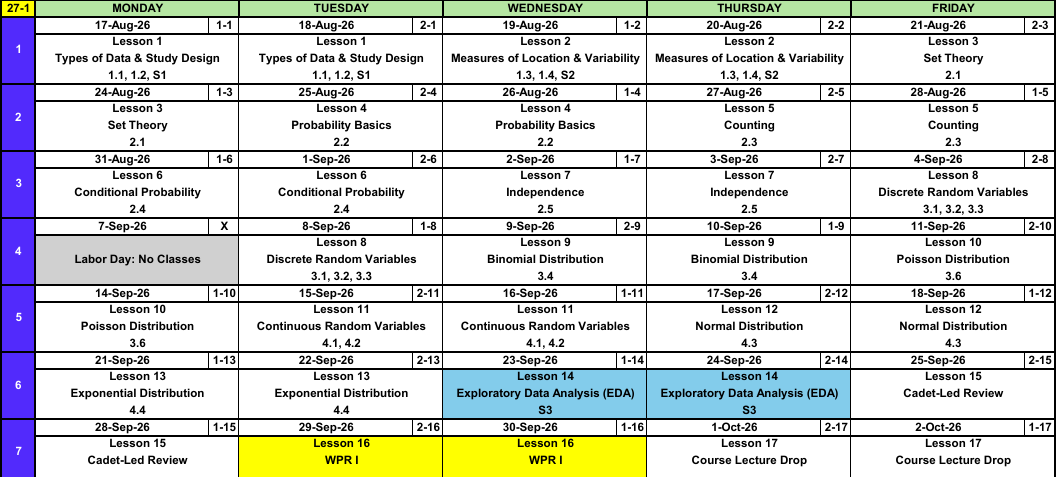
- Descriptive Statistics - types of data, study design, measures of location and variability
- Probability - set theory, basics, counting, conditional probability, independence
- Random Variables - discrete (binomial, Poisson) and continuous (normal, exponential)
Block II: Statistical Inference
Lessons 17-28, WPR II at Lesson 28.
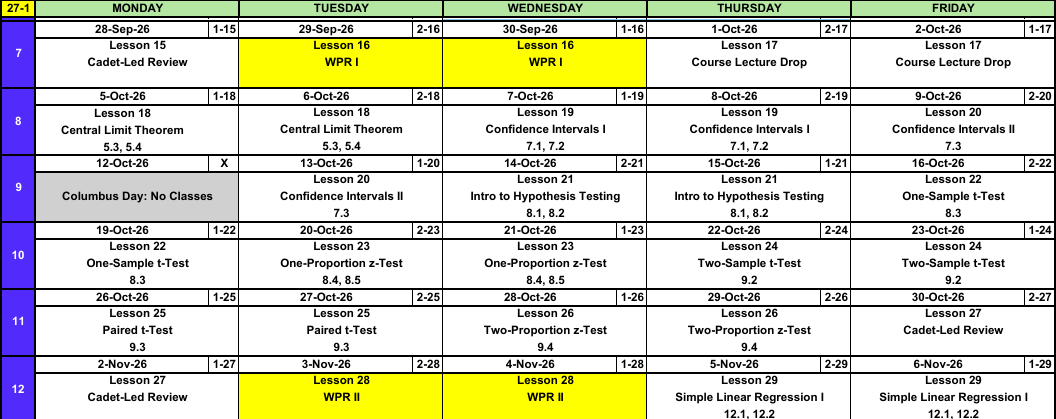
- Sampling distributions and the Central Limit Theorem
- Confidence intervals and hypothesis testing
- One-sample \(t\), one-proportion \(z\), two-sample \(t\), paired data, two-proportion \(z\)
Block III: Regression and the Analysis of Variance
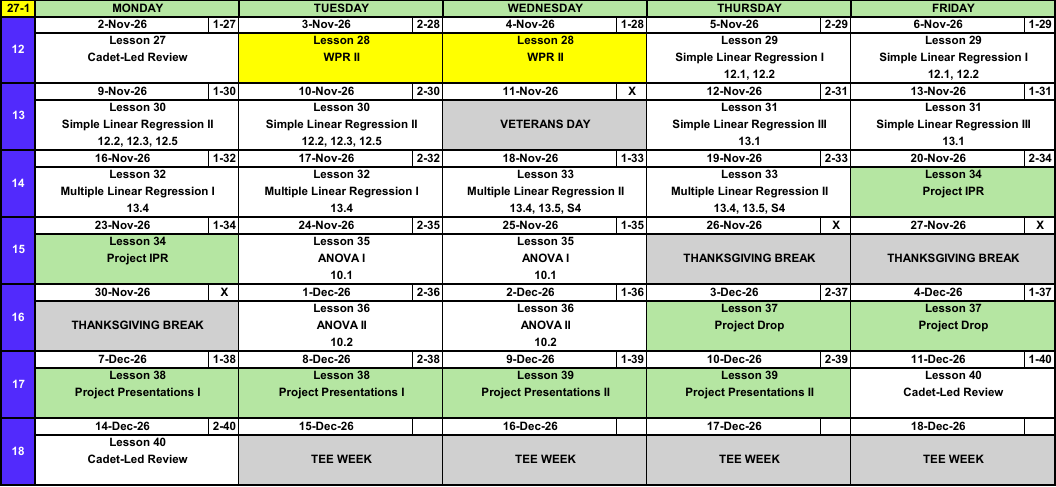
Lessons 29-40, Project and TEE.
- Simple and multiple linear regression
- Analysis of variance
Where the Points Are
| Graded Event | Points |
|---|---|
| WebAssign Homework | 150 |
| WPR I (Lesson 16) | 175 |
| WPR II (Lesson 28) | 175 |
| Project | 200 |
| EDA (Lesson 14) | 25 |
| IPR (Lesson 34) | 25 |
| Products (Lesson 37) | 50 |
| Brief (Lessons 38-39) | 100 |
| TEE | 300 |
| Total | 1000 |
WebAssign
- 150 points of the course.
- Due before every lesson, at the start of class.
- 5 attempts per sub-question.
- AI is welcome here. Document it IAW the DAAW and own what you submit.
WPRs / TEE
Two Written Partial Reviews and the Term End Exam, 650 of 1000 points between them.
| When | Covers | Points | Time | |
|---|---|---|---|---|
| WPR I | Lesson 16 | Lessons 1-13 | 175 | 55 min |
| WPR II | Lesson 28 | Lessons 18-26 | 175 | 55 min |
| TEE | 15-18 Dec | Lessons 1-39 | 300 | 3 hr 30 min |
- No AI.
- You get the SRC, a cumulative reference card.
- Cadet-led review the lesson prior (15, 27, 40).
- The WPRs are not cumulative. The TEE is.
The Course Project
You will run a statistical investigation on real data from an actual Army unit, hosted inside Army Vantage. You pick one of five published unit-level datasets. Account instructions are on Canvas.
| Event | Lesson | Points |
|---|---|---|
| Exploratory Data Analysis | 14 (23-24 Sep) | 25 |
| In-Progress Review | 34 (20-23 Nov) | 25 |
| Products | 37 (3-4 Dec) | 50 |
| Brief | 38-39 (7-10 Dec) | 100 |
- 200 points spread across the semester. Work it concurrently.
- AI is welcome. Document it IAW the DAAW and own the result.
Course Support
TipResources
| Resource | Link |
|---|---|
| Canvas | MA206 Canvas |
| Cengage WebAssign | WebAssign (access instructions on Canvas) |
| Army Vantage | Army Vantage |
| Syllabus | Course Syllabus |
| Calendar | Course Calendar |
| Textbook | Devore, Probability and Statistics for Engineering and the Sciences, 9th Ed. |
| Supplemental Readings | Posted on Canvas, labeled S1, S2, and so on in the Read column |
| Additional Instruction | Email me to coordinate |
Today’s Lesson
Objectives
- Distinguish populations, samples, and processes; contrast descriptive and inferential statistics; and distinguish a statistic from a parameter. (SLO 3)
- Classify data as categorical or numerical, and numerical data as discrete or continuous. (SLO 2)
- Construct and interpret histograms, and describe distribution shape. (SLO 2)
- Describe data-collection methods, including simple random sampling and observational versus experimental studies. (SLO 3)
Reading: Devore 1.1, 1.2 and Supplement S1
The Big Picture
Why do we collect data? Because we want to learn about something bigger than what we can directly observe.
| Term | Definition |
|---|---|
| Population | The entire collection of objects or individuals we want to learn about |
| Sample | The subset of the population we actually observe |
Descriptive statistics summarizes the data you have. Inferential statistics uses that sample to make a claim about the population you cannot see. The whole course is built on that move.
Parameters vs Statistics
| Population | Sample | |
|---|---|---|
| What we have | Usually unknown | Observable data |
| What we call it | Parameter | Statistic |
| Notation | Greek letters (\(\mu\), \(\sigma\), \(p\)) | Latin letters (\(\bar{x}\), \(s\), \(\hat{p}\)) |
A statistic is computed from the sample and is used to estimate a parameter.
Every time you see a number in this course, ask whether it is a parameter or a statistic. If it came from data, it is a statistic, and it will be a little bit wrong. Quantifying how wrong is Block II.
Types of Data
| Type | Definition | Example |
|---|---|---|
| Categorical | A label or category | Branch, company, pass/fail |
| Numerical, discrete | Values can be listed, usually counts | Vehicles deadlined |
| Numerical, continuous | Values form an interval | Repair time, distance, weight |
The type of variable determines how you summarize it, how you picture it, and which inference method you will use in Block II.
| Variable type | Summarize with | Picture with | Block II method |
|---|---|---|---|
| Categorical | Proportion \(\hat{p}\) | Bar chart | \(z\) procedures for proportions |
| Numerical | Mean \(\bar{x}\), SD \(s\) | Histogram, boxplot | \(t\) procedures for means |
A variable coded with numbers is not automatically numerical. Company coded 1-9, or a 1-5 satisfaction rating, is still categorical. Ask whether the arithmetic means anything: is the average of Company 2 and Company 4 really Company 3?
Histograms
A histogram splits the number line into bins of equal width, counts how many observations land in each bin, and draws a bar of that height. It answers three questions at a glance: where is the data centered, how spread out is it, and what shape does it have?
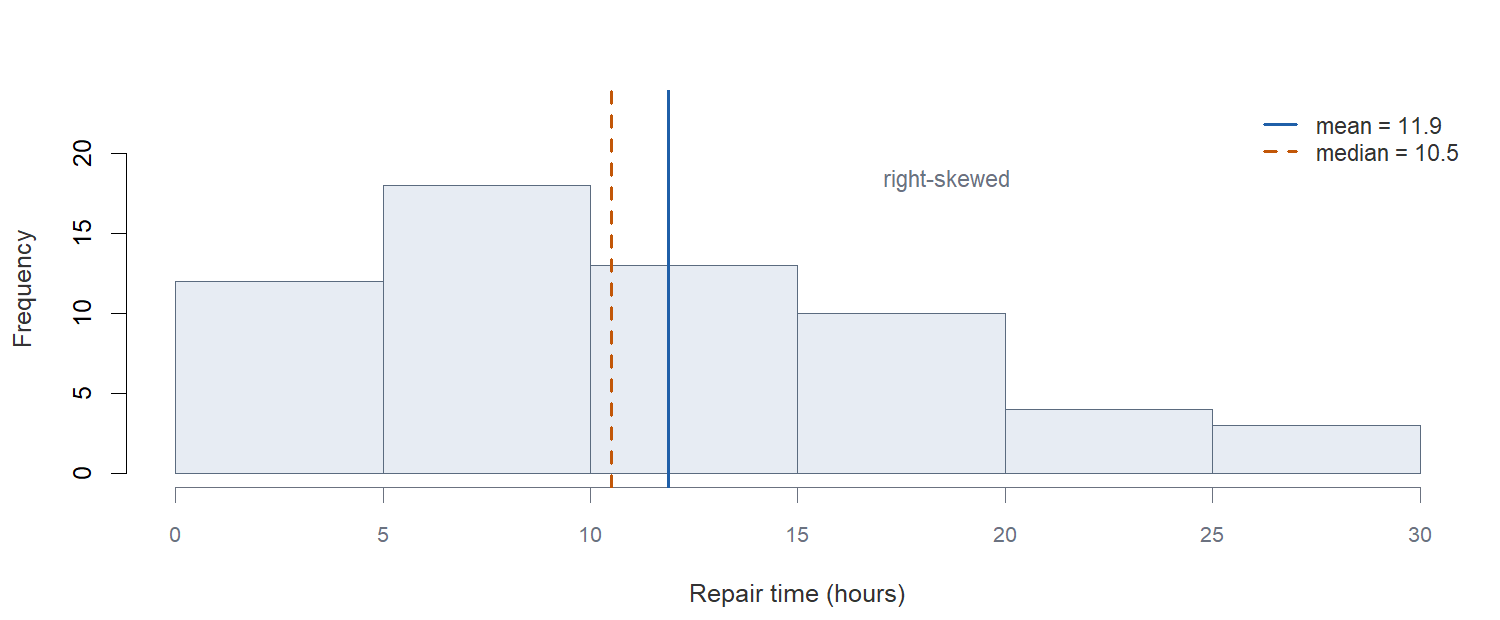
Repair times for 60 jobs. Notice what the long right tail does: it drags the mean above the median. The mean follows the tail; the median does not.
To read a histogram, report center, spread, and shape, then say whether anything is unusual. Outliers and gaps are findings, not nuisances. In the Army they are often the whole point: the one vehicle that took 40 hours to fix is the one your commander wants to hear about.
Describing Shape
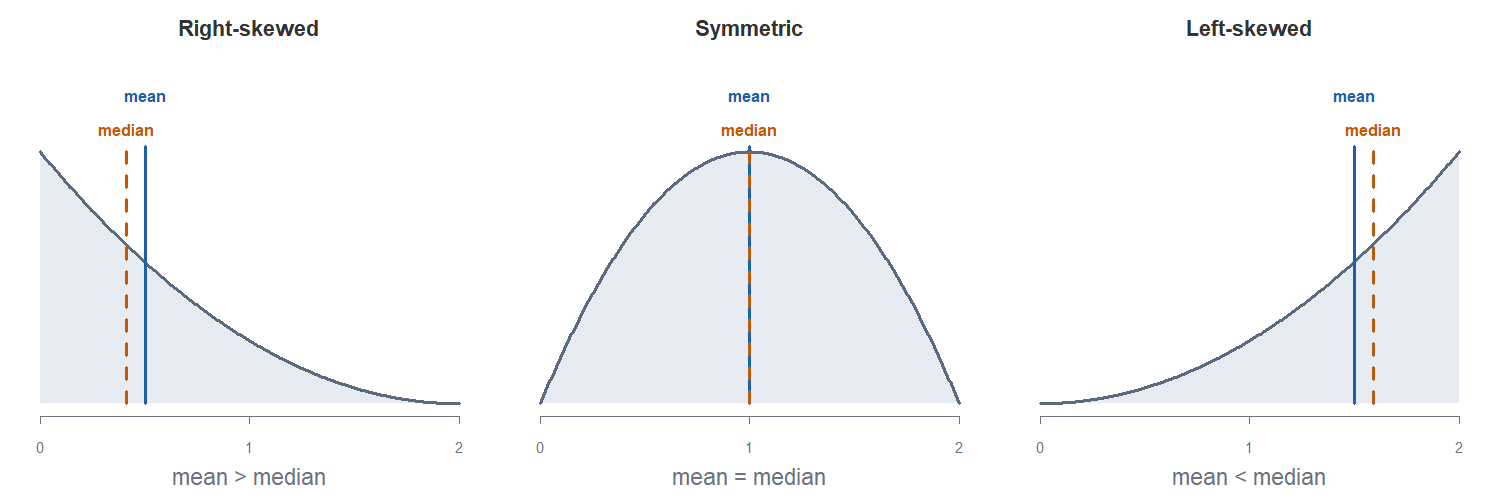
Shape is named for the direction the tail runs.
| Shape | Tail | Center |
|---|---|---|
| Right-skewed (positively skewed) | Runs right | mean > median |
| Symmetric | Halves mirror each other | mean \(\approx\) median |
| Left-skewed (negatively skewed) | Runs left | mean < median |
Collecting Data
How you got the data limits what you are allowed to say about it.
A simple random sample (SRS) of size \(n\) is chosen so that every possible sample of size \(n\) has the same chance of being selected. This is what makes inference from the sample to the population legitimate.
There are two kinds of study.
| Study | What you do | What limits it |
|---|---|---|
| Observational | Observe and record; you do not assign the conditions | Groups may differ in ways you did not measure |
| Experiment | Assign subjects to conditions, ideally at random | Random assignment balances what you did not think to measure |
That distinction sets up a rule that survives the whole course.
Random sampling buys you the right to generalize from the sample to the population. Random assignment buys you the right to claim the treatment caused the difference. They are different tools, and you need both to say this caused that and it holds for everyone. An observational study, no matter how large, does not establish causation.
Board Problem: A Motor Pool Study
The battalion maintenance officer wants to know whether a new diagnostic procedure shortens repair times. There are 240 vehicles in the battalion. She selects 30 at random, records the repair time in hours for each, and finds a mean of 12.4 hours.
NoteQuestions
- What is the population? What is the sample?
- Is 12.4 a parameter or a statistic? What notation would you use?
- Classify “repair time in hours” and “vehicle type” by data type.
- Is this an observational study or an experiment?
- She finds that vehicles run through the new procedure averaged 3 hours less. Can she conclude the procedure caused the reduction? What would she have had to do differently?
TipAnswers
Population: the repair times of all 240 vehicles in the battalion. Sample: the 30 vehicles she selected.
A statistic, written \(\bar{x} = 12.4\). The corresponding population parameter \(\mu\) is unknown, which is exactly why she took a sample.
Repair time: numerical and continuous (any value in an interval). Vehicle type: categorical, even if the motor pool codes it as a number.
As described, observational. She recorded what happened; she did not assign vehicles to procedures.
No. Vehicles that got the new procedure may differ systematically, maybe newer vehicles, maybe a more experienced crew, maybe the easy jobs. To claim causation she needs to randomly assign vehicles to the old or new procedure. Random selection alone gets her generalization; random assignment is what gets her cause.
Before You Leave
Today
- Population vs sample
- Descriptive vs inferential statistics
- Parameter vs statistic: Greek is unknown truth, Latin is what your data gave you
- Categorical vs numerical, and discrete vs continuous
- Histograms: center, spread, shape, and what the tail does to the mean
- Skew is named for the tail
- Random sampling gets you generalization; random assignment gets you causation
Any questions?
Next Lesson
Lesson 2: Measures of Location & Variability
- Sample mean, median, and trimmed mean, and their sensitivity to outliers
- Sample variance, standard deviation, range, and fourth spread (IQR)
- Boxplots, comparative boxplots, and identifying outliers
Reading: Devore 1.3, 1.4 and Supplement S2
Upcoming Graded Events
- WebAssign 1.1, 1.2 - Due at the start of Lesson 2
- EDA (Project) - Lesson 14
- WPR I - Lesson 16 (covers Lessons 1-13)